
Evaluation of Reflectance Transformation Imaging vs. Photogrammetry for Characterizing Painting Surfaces
On this Page:
Measuring and characterizing the surface topography can be valuable when documenting a painting. The data gathered aids in monitoring change and evaluating condition before, during, and after treatment. In the documentation preceding Sue Ann Chui’s treatment of Rembrandt van Rijn’s Man with a Sheet of Music, 1633 (fig. 1), we pursued different imaging methods, and here we present a comparison of the methodologies. In this study, we chose to evaluate both reflectance transformation imaging (RTI) and photogrammetry methods. Our goal was to compare the advantages and tradeoffs of each approach with respect to accessibility and the value of the data generated.
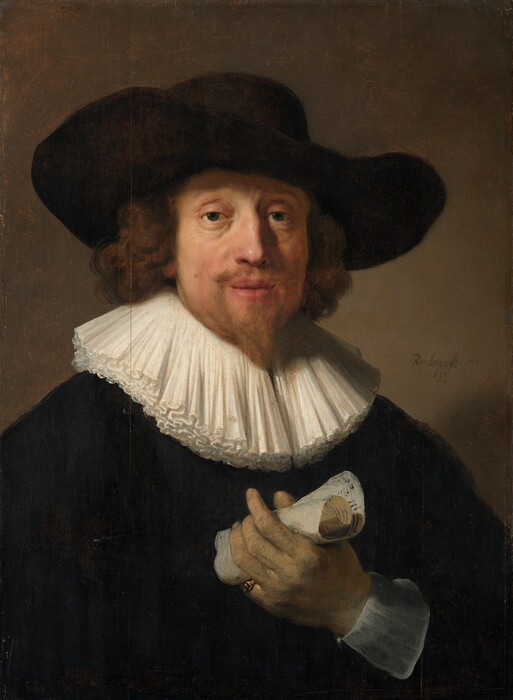
Fig. 1. Rembrandt van Rijn, Man with a Sheet of Music, 1633, oil on panel, 66 × 48 cm, National Gallery of Art, Washington, Corcoran Collection (William A. Clark Collection), 2014.136.41.
Reflectance Transformation Imaging
The earliest studies in documenting the surface topography of paintings took place in the 1990s using different techniques such as moiré fringe analysis, RTI, and related photometric stereo techniques such as polynomial texture mapping (PTM). These are computational photography methods used to document and analyze the surface textures and topography of objects. These imaging processes excel in documenting low-relief textures and are well suited to showing the surfaces of paintings to reveal impasto, cracks, or other surface deformations.
RTI is desirable because while it is based on quantitative measurements such as surface normal angles, RTI viewers enable the user to relight the surface virtually. This allows for an intuitive understanding of the nature of the surface as if one were inspecting it with a directional light source (e.g., a flashlight). There are a number of recontruction methods that use different coefficients. PTM and hemispherical harmonics (HSH) are among the more commonly used, and there have been comparisons of these methods. Recently there have been proposals for newer methods such as radial base function interpolation combined with principal component analysis compression (RBF+PCA) that may offer improvements.
Because RTI only computes values required to relight the surface, such as surface normal angles and reconstruction coefficients (e.g., HSH), it allows for visualization of the surface texture without a complete reconstruction of the geometry. This results in much lower processing requirements compared to building and rendering a full three-dimensional representation of the surface. The Highlight RTI capture method requires only a camera, a flash, a string to keep a consistent illumination distance, and a simple glossy sphere to identify the angles of illumination. The resulting images can be processed and viewed using free and open-source software packages. The lack of the need for specialized equipment, along with free and simple processing and viewing software, greatly reduces the barrier to entry. Combined with the lower computational needs for rendering high-resolution images, this has made RTI a popular technique for documenting surface details for over a decade.
It is important to note that RTI is not a 3D model, in that it is always viewed straight-on from the same singular position where the camera was located when taking the imaging set; there is no ability to rotate and view the surface from an angle. While one can infer information about the deformation of the surface from relighting or evaluating the surface normal data, the process does not allow for measurements of height and depth, and viewing can be prone to illusions that make it unclear if an area is receding or proud.
Photogrammetry
As computing power has substantially increased, photogrammetry, a means of rendering the geometry of surfaces as a 3D model from photographic images and computing the depth based on parallax between images taken from different positions, has gained popularity for cultural heritage documentation. Starting in the 1990s, photogrammetry was used to study the movement of paintings on wood in relation to changes in relative humidity. The resolution has exponentially increased, from measuring 25 points over a 600 × 600 mm surface with a precision of 0.01 mm while relying on retro-reflective targets to be placed on the surface to being able to measure millions of points over a similar area with comparable precision and no need for targets placed on the surface. In this study we were able to sample over 314 million points over the 660 × 480 mm surface of the painting. Software was used to compute the depth of features through computational analysis of the parallax. This can be highly computationally intensive but can result in quantifiable distance measurements of the surface.
There are a few modalities of 3D data that can be generated from photogrammetry. The first is a point cloud made of precise measurements of the surface in 3D space. While having finite measurements at points is valuable, as the term “cloud” implies, it can be difficult to quantify a surface or volume. A mesh is made of polygonal (often triangular) “faces” to approximate a solid surface; this can be useful in different types of comparative analysis, as well as allow other visualization techniques such as applying image-based textures or relighting the surface better than a point cloud. There are additional representations such as digital elevation models (DEM) and depth maps that represent 3D height as values from a 2D plane or from a given field of view. These values can be visually represented as colors or grayscale tones.
RTI Capture Methodology
To capture the RTI data set, a PhaseOne iXH 150 MP camera was used with a Canon EX-600 strobe light employing the Highlight RTI capture method in which multiple images are taken with the camera at a fixed position and the strobe light is placed at varying angles while a manual flash exposure at a set distance ensures consistent exposure across the set. A 64-inch-long string was used during the placement of the strobe to maintain consistent distance from the light source to the object while varying the angle of illumination. A pair of glossy black spheres were included in the capture area, from which the RTI building software was able to determine the angle of illumination in each image (fig. 2). In this set, 160 images were captured; however, this number could likely have been reduced to 60 to 70 images with minimal impact on the quality of the resulting render. The higher number of images we utilized provides a worst-case example for processing times by using a number of images comparable to those needed for the photogrammetry tests. Files were exported from Capture One Pro Cultural Heritage software using linear profiles and saved as JPGs. An RTI file was generated using the open source Relight Builder and the HSH method with 27 planes (9 per color channel).
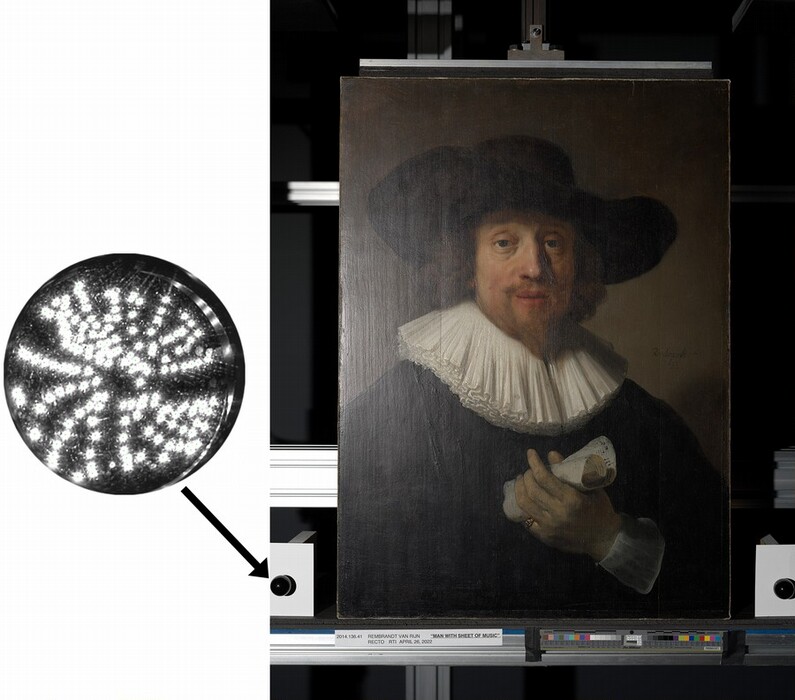
Fig. 2. One image from the RTI capture set. Inset is a composite image of a black sphere showing all of the lighting positions used to compute the reflectance transformation imaging.
Photogrammetry Capture Methodology
To create the 3D model using photogrammetry, the panel was placed on a computer-controlled motorized easel that allowed for convenient repositioning of the panel relative to the camera. This enabled us to capture images of the surface from several angles easily and safely. We used a Phase One iXH 150MP designed for cultural heritage use (the same camera system employed to capture the RTI images) with a 53.7 × 40.4 mm (3.76 µm pixel pitch) sensor and a Phase One 72mm Mk II lens (with a diagonal field of view comparable to a 46mm lens on a 135 format “full-frame” sensor) to capture a series of 166 images (fig. 3).
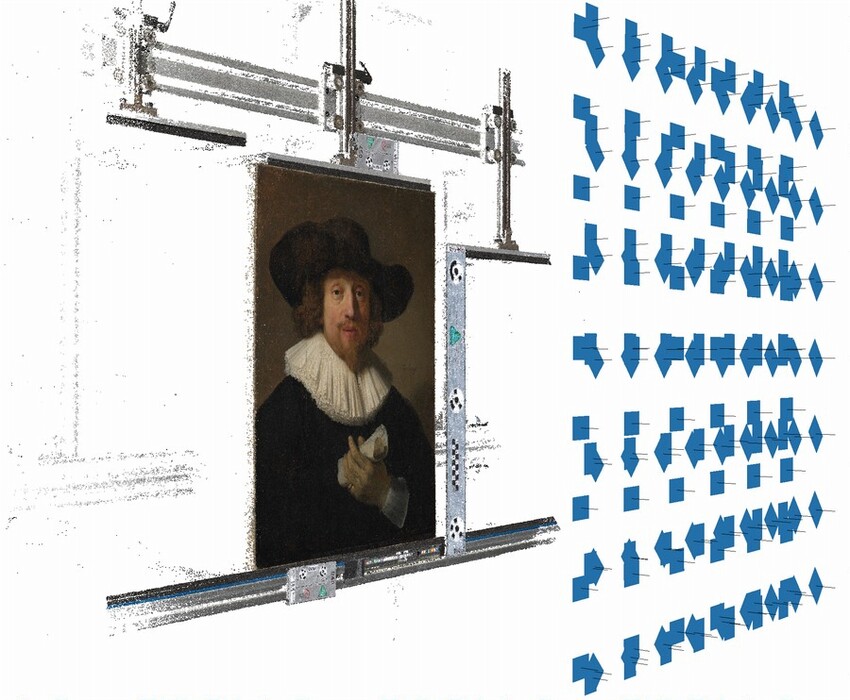
Fig. 3. View showing the software alignment of the photogrammetry captures. Blue rectangles illustrate the relative camera positions to the painting on the easel.
The camera was kept with the sensor in plane to the panel while moving the easel in the x- and y-axes and making captures with at least 67% overlap of the field of view in both directions, ensuring every point on the surface appeared in different locations in at least 9 images. Redundant sets were included with the camera rotated at -45º and +90º around the optical axis to have more points of the painting captured through different areas of the lens, ensuring at least 27 images for nearly every point on the surface to better characterize and calibrate for any lens distortion using a method based on one developed by the US Geological Survey (USGS). Exposures were made using LED lighting with correlated color temperature of 5000 K, providing an illumination with a color similar to natural daylight. To ensure color accuracy, the LEDs used have a color rendering index (CRI) of over 98. An aperture of f/9 previously has been determined to have the highest spatial frequency response (SFR) on this lens and sensor system. The peak SFR at f/9 indicates it will provide the best possible sharpness for the system, and this setting was used for all exposures. Calibrated scale bars were included in the capture area to set and validate the scale to submillimeter precision. Images were captured at a distance to create a magnification of approximately 815 pixels per inch (ppi) at the object or approximately 31.1 µm/pixel. Focus distance was maintained throughout exposures to avoid any change in the optical system. RAW images from the camera were processed into TIFFs from Capture One Pro Cultural Heritage software where linear curves with color matching input profiles were applied, with no additional tonal adjustments or sharpening. Images were aligned in Metashape Professional Edition, a commercial photogrammetry software package. Through iterative refinement for lens correction using a modified version of the USGS method, root-mean-square (RMS) reprojection error was reduced to 0.199 pixel with a maximum reprojection error of 0.588 pixel. Low RMS error is used as an indicator of reduced uncertainty in the camera location alignment and to ensure that the reconstruction is based on reliable data. Using a graphics workstation computer with two NVIDIA RTX 4090 GPUs and 512 GB of RAM, the initial camera alignment was completed in approximately 32 minutes. After alignment, optimization for lens corrections and definition of a region of interest required about an hour of user time. Building a high-resolution point cloud was more time-intensive, requiring approximately 18.5 hours of processing time on the PC workstation to complete a cloud made up of over 314 million unique measurement points across the surface in 3D space. A mesh of 26 million faces required nearly 16 hours of processing time. Refinement of the mesh is possible to generate more faces but requires substantially more processing time. Even with a very powerful computer and commercial software, the photogrammetry processing required multiple days to complete and substantial intervention by a trained technician during that time.
Reviewing RTI Data
Viewing the RTI file in the RTIViewer software allows the user to move the lighting angle and simulate raking lighting from various directions, which helps illuminate peaks and valleys in the surface (fig. 4a). In the RTIViewer desktop software and the OpenLIME web viewer, there are settings that allow one to apply specular surface reflection properties to exaggerate details and make them more visible (fig. 4b). One can also view a surface normal map that encodes the angles of the surface by color. However, while the surface normals provide quantitative data, it is often considered more difficult to interpret than the more natural approach of lighting angles.
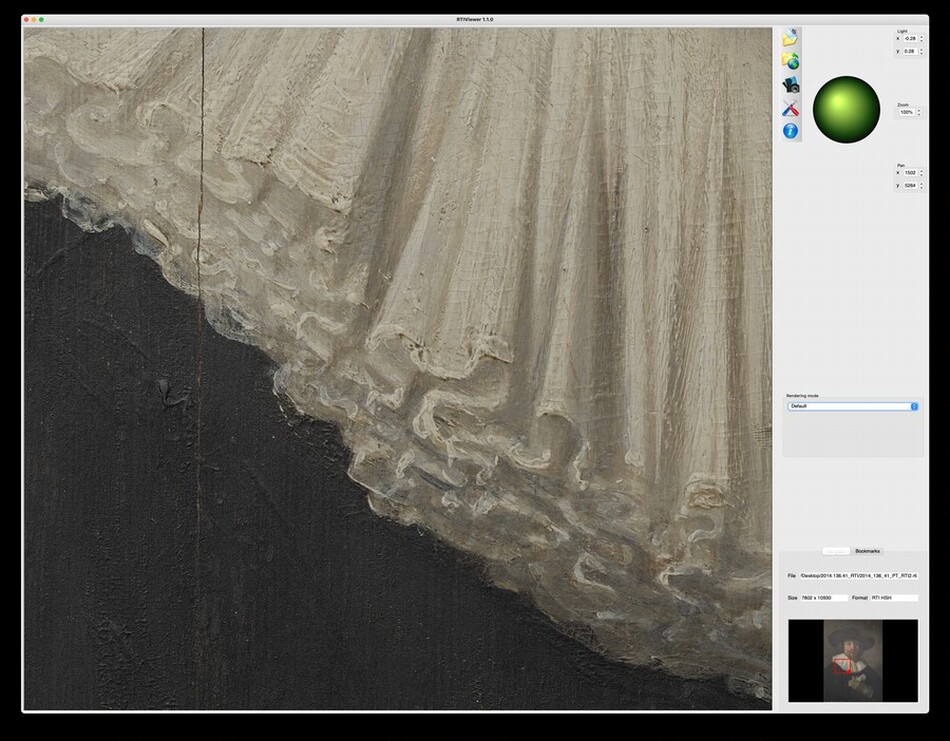
Fig. 4a. RTIViewer software allows the user to move the lighting position by moving the position on the green circle.
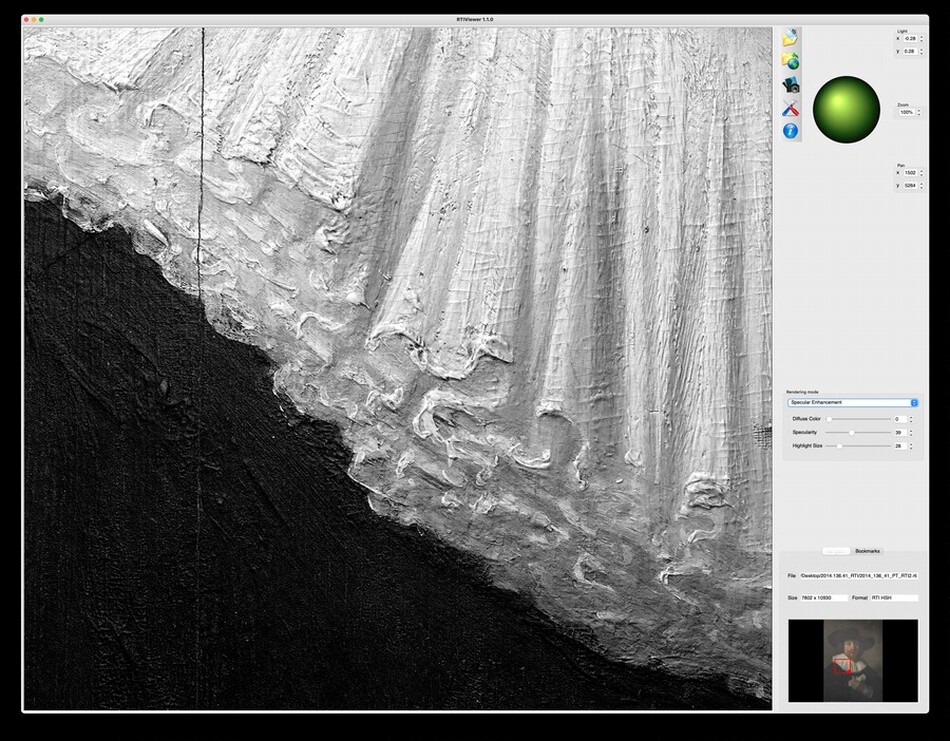
Fig. 4b. The same view as figure 4a but with specular enhancement set to increase contrast of details.
[Placeholder slider caption]
The RTI Builder provided by Cultural Heritage Imaging, commonly used by the cultural heritage community to create RTI files, was last updated in 2012 and no longer functions on modern operating systems. In early 2023, the Visual Computing Group of CNR-ISTI released a new Relight RTI Builder (see note 18) along with the web-based RTI viewer OpenLIME. Using this new builder, we are able to generate an RTI file from the 160 images from the iXH camera, which produces very large 150 megapixel images in approximately 30 minutes. The results can be saved as .RTI files, which can be opened in the relatively easy to use Windows- or MacOS-based RTIViewer. The new Relight Builder can be used to create an OpenLIME viewer file set, effectively creating a website that can be used to post the results online. While the new web browser viewer has the potential for easy sharing, it requires technical expertise to run a web server to host the viewer and files online.
Reviewing 3D Photogrammetry Data
Three-dimensional data, such as that produced by the photogrammetry process in our experiments, has more variations and can be viewed in a multitude of ways. A 3D point cloud can be computed to provide precise measurements in space, the surface of the object can be represented as a mesh that can be shown at various angles or relit, or 3D data can be converted to a 2D representation such as a DEM or surface normal angles of the mesh. Unlike most RTI methods, the surface can be represented with the diffuse albedo (base color of the surface) removed, which is helpful if the painting has lines or colors that create illusions of depth when none exists.
The 314 million point cloud and 26 million face mesh generated are very large files and can cause even powerful computers to struggle. In addition, full-featured 3D viewers are often not intuitive or user-friendly. To visualize the data more easily without computational constraints, the 26 million face mesh was decimated to a lower-resolution mesh with 250,000 faces, drastically reducing the size of the file. While the mesh retained enough data to understand the basic shape of the surface, finer textures such as areas of impasto lost all fine detail. To include fine detail, surface normals were calculated from the high-resolution mesh and saved as a texture map to wrap the low-resolution mesh. Many 3D viewers use these normal texture maps to add lighting to surfaces at lower computational costs than the full-resolution mesh. These surface normal textures allow the model to be relit, showing fine texture and details, and can be shown in a web viewer that works on most computers or even mobile devices. The relighting capability may seem similar to the RTI approach, but it is improved by the fact that a low-resolution 3D model still underlies the normal map. Unlike in RTI, we can rotate the low-resolution 3D model and remove the diffuse albedo photographic textures, enabling us to view the surface of the geometry only and relight the computed surface based on the normal maps. The downside of using the lower-resolution mesh is that the viewing experience is more qualitative, as we do not have the high precision geometry needed to make accurate spatial measurements. But for cases in which a more qualitative or intuitive understanding of the surface that those using RTI have come to expect is desired, this approach allows for high-resolution 3D models to be presented in a more approachable interface. The model was uploaded to the online 3D platform, SketchFab, which allows for viewing through any web browser, with no additional software required. In the SketchFab viewer, one can disable the relighting based on the normal texture, revealing the loss of visual detail that resulted from reducing the number of faces, or render in “mat-cap + surface” mode and relight the surface using the surface normal to reveal the lost texture (fig. 5a, b). The level of detail in decimated mesh with surface normal lighting is comparable to the detail seen in the original mesh (fig. 6).
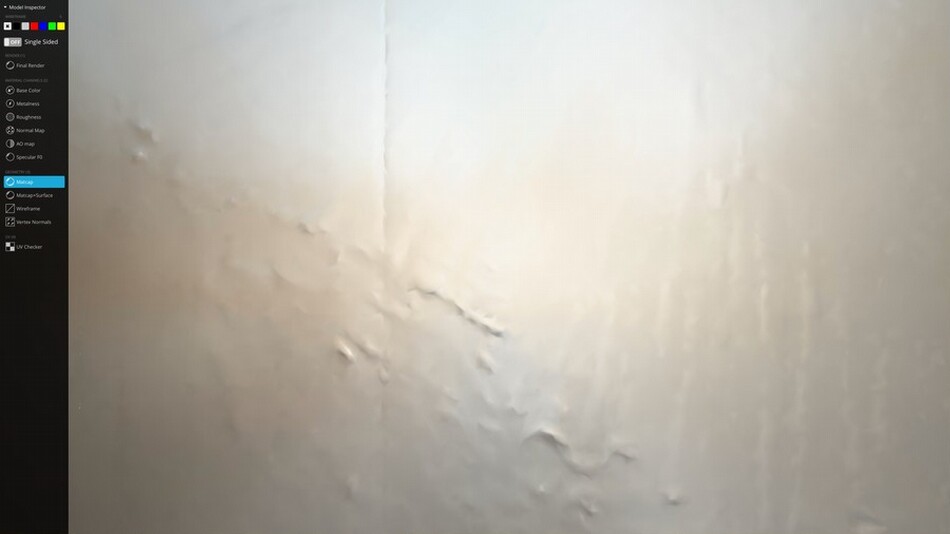
Fig. 5a. Sketchfab web viewer: low-resolution geometry with surface normal disabled, showing lack of fine detail.
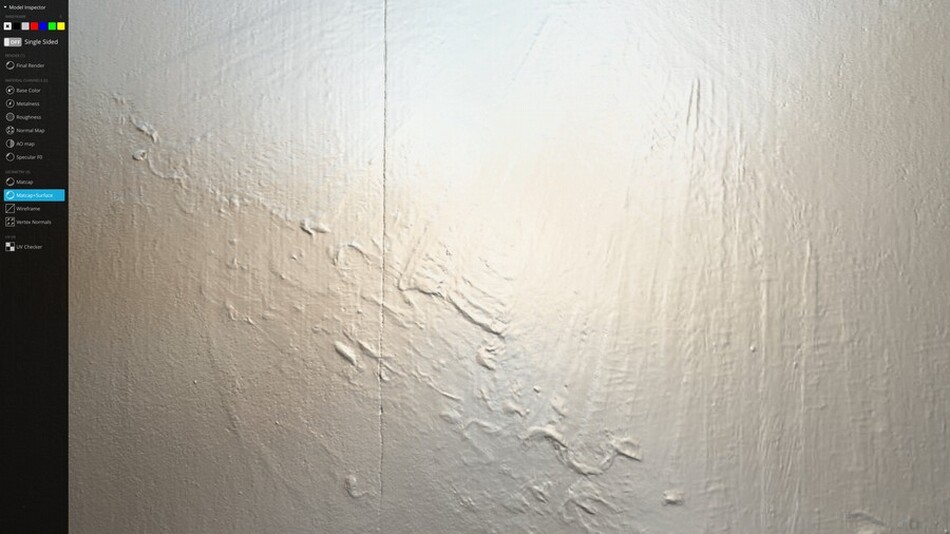
Fig. 5b. Sketchfab web viewer: the same geometry with a surface normal texture applied to allow lighting to highlight the fine details.
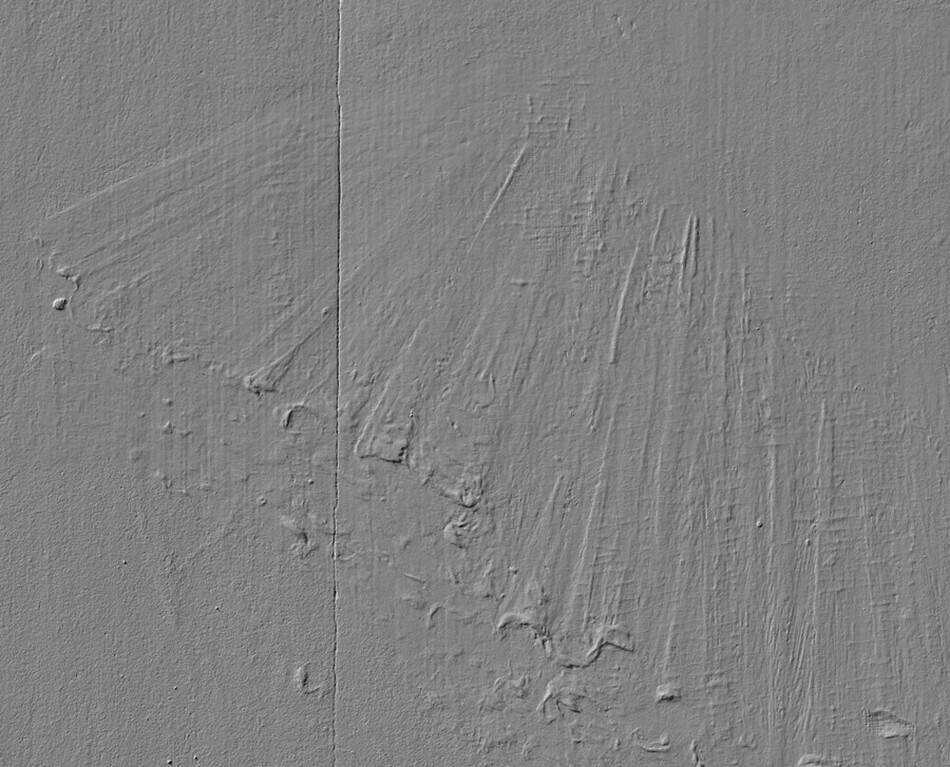
Fig. 6. 3D model rendered in Blender, showing the surface with no diffuse albedo or surface coloring, allowing the user to see only the surface geometry under a raking light.
Desktop 3D software is often much more complicated. While this software has far more options, those options increase the hurdles to sharing and opening 3D files locally. The complexities of the software require substantial experience, increasing the barriers to utilization. However, there are online viewers in which once the files are properly processed, the 3D assets can be uploaded to an online service and shared via the web with a much simpler interface. With the increasing popularity of 3D formats outside of the cultural heritage sector, we expect there will be even more options for sharing and viewing 3D models online in the future.
Technical Conclusions
Our evaluation revealed that both RTI and photogrammetry have advantages and disadvantages. Reflectance transformation imaging is more approachable in terms of capture and processing. Processing for the 3D models generated by photogrammetry is substantially more time-consuming and requires more skill. More information can be captured in 3D, but 3D software is much less intuitive than the RTIViewer. For viewing on the web, 3D requires additional processing, but the files can leverage online 3D platforms that enable easier sharing. For many uses, RTI provides sufficient detail to understand the surface of the object and is more easily accessible, especially with the new Relight Builder and OpenLIME web viewer.
When the goal is to reveal surface textures, both methods can be used in many cases, but there are differences in what can be done. While RTI viewers often have specular enhancement viewing modes that help accentuate the shape while relighting, the brightness or darkness of the painted surface will still affect the final render. In contrast, the 3D model from photogrammetry can be rendered as if the surface is all the same material color (see fig. 6). In addition, within the 3D space, models can be rotated to mitigate “hollow-face illusions” and better illustrate if a feature is proud or recessed or the data can be processed into other modalities such as digital elevation maps as a different way to present topography, if applicable. While 3D data provides many more options, those options make the process far more complex. Capturing 3D data at the high resolution needed to reveal such textures comes with costs in the processing time and computing power needed to render the views.
While training is recommended to capture and process both RTI and photogrammetry with repeatability and precision, photogrammetry processing has a higher level of complexity and reviewing the 3D data often requires more expertise. The biggest limitation of photogrammetry is the computational requirements (table 1). While RTI processing can be performed on a reasonably powerful laptop, photogrammetry processing at the level of detail desired required 95.59 GB of RAM to build the mesh model and over 170 GB of RAM to build the point cloud (see notes 21, 22) The monetary cost of the computer and commercial photogrammetry software along with potentially days-long processing times make this process prohibitive at present for all but the most high-value projects. It is expected that software and computational power will continue to improve, which may make these methods viable for more projects in the future.
| RTI | Photogrammetry | |
|---|---|---|
| Capture skill needed | moderate | high |
| Processing skill needed | moderate | very high |
| Captures created | 160a | 166b |
| Time to create capture set | ~2 hours | ~3.5 hours |
| Time to process set | ~45 minutes | 2+ days |
| Computer used | Mac laptop with 64 GB RAM | PC workstation with 512 GB RAM and dual GPUs |
| Desktop viewers | RTIViewer (easy to use) | Blender; Metashape (complex) |
| Web viewer | OpenLIME (requires webhosting) | SketchFab (paid online service) |
| Capabilities | move lighting position accentuate specularity view surface normal zoom and pan across image | relight surfaces generate depth maps shade surface (remove color) compare heights zoom, pan, and rotate object |
Table notes
a. 60–70 images would have been sufficient for RTI captures.
b. Number increases exponentially as resolution requirements increase.
Application to Treatment
While RTI was the initial imaging technique proposed, the 3D model generated by photogrammetry allowed for a more detailed understanding of the deformation of the surface. A DEM (fig. 7) produced from the initial photogrammetry capture provided a simple but quantitative visual to understand the topography of the surface that did not require the use of specialized software to interpret. This was valuable for defining the initial condition of the panel as a basis of quantitative comparison through the treatment and into the future.
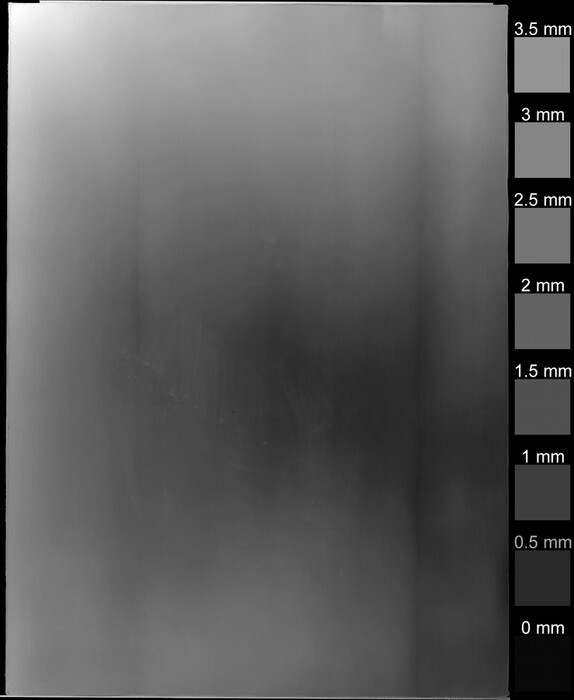
Fig. 7. A DEM rendered from the pretreatment photogrammetry capture showing the height across the surface of the panel. White indicates a positive z value (coming toward the viewer); black indicates the farthest points.
Since the initial evaluation, we have repeated the photogrammetry process to create 3D models of the surface of the Rembrandt panel during stages of treatment, before and after partial removal of the auxiliary support, where the hardboard backing and roughly half the thickness of the balsa-block backing was removed. With 3D geometry, we can create a direct comparison that depicts how the panel changes from its initial shape as the backing is reduced. To accomplish this, two photogrammetry sets were made before and after the first stage of removal of the panel’s backing. The two meshes were aligned using GOM Inspect software with a localized best-fit alignment on a selection at the center of the panel. A surface comparison was then computed to determine the distances between the two meshes. We were able to create a color map comparing the pretreatment to the removal of the hardboard backing, showing how the surface has flattened; it revealed that the surface receded as much as 4 mm in the extreme corner after partial removal of the auxiliary support (fig. 8). This change between these two photogrammetry measurements appears to correlate with the deformation documented in DEM made from a different measurement taken before treatment began (see fig. 7).
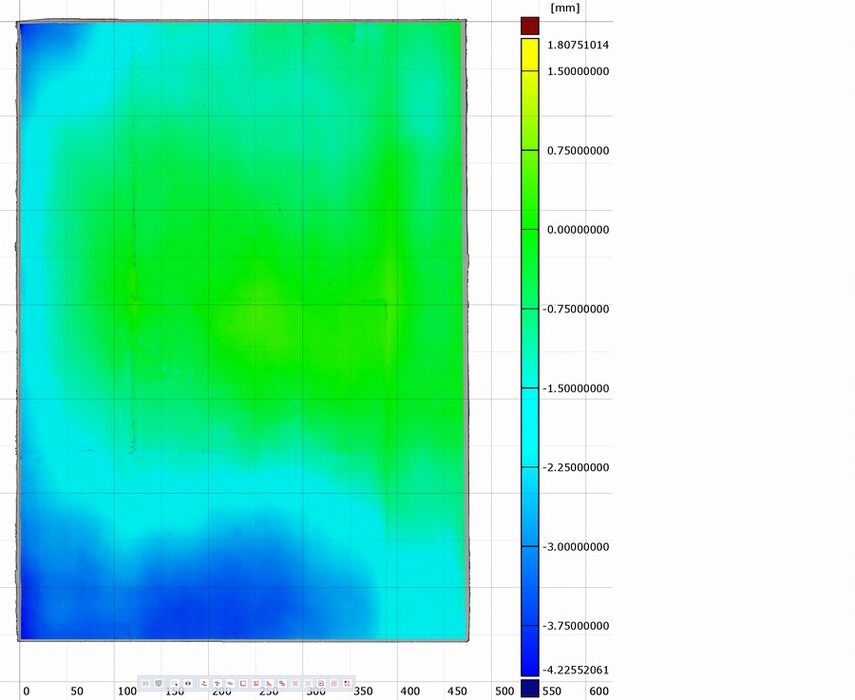
Fig. 8. Difference map showing the change in distances in the 3D models between the pretreatment and the first stage of planing of the auxiliary support. Green indicates minimal change (~0 Δz); blue shows the surface receding in height (-Δz) by approximately 4 mm.
Future Work
We plan to repeat the photogrammetry process through the final stages of treatment to monitor the surface as treatment progresses. While RTI is not as quantitative as photogrammetry, we plan to create an after-treatment RTI to have more complete documentation. At that time we hope to have a further evaluation of the newer RBF+PCA RTI method compared to HSH in the context of this object. We are also monitoring new methods of improving the material appearance of photogrammetry captures that promise to improve the ability to faithfully relight surfaces by better accounting for metallic and gloss properties on a surface by measuring the Spatial Varying Bidirectional Reflectance Distribution Function. In addition, we are in the process of evaluating open-source comparison software such as MeshLab and CloudCompare as alternatives for comparing 3D data without commercial software such as GOM Inspect. We continue to monitor the development of new web-based 3D viewer and annotation tools for collaborating with 3D data, such as those being led by the International Image Interoperability Framework’s (IIIF’s) 3D Technical Specification Group. At this time the computational needs of photogrammetry are a significant barrier, particularly for smaller institutions. The Agisoft Metashape software we used in this study for photogrammetry has begun to offer fee-based cloud-based processing, and there are other third-party high performance computing platforms that may be worth investigating as a way to either reduce processing time or provide options to those who cannot justify purchasing a very expensive computing workstation for a small number of projects.
After the treatment is completed, the 3D model can be used as a baseline to monitor the panel for any changes in shape that may occur in future. Having the record of the previous deformation, we have an idea of the range of out-of-plane movement that is possible. Beyond these measurements, materials modeling experiments could one day lead to the creation of tools that can predict the safe limits of movement for paintings on wood.
Acknowledgments and References
The authors thank Rebecca Clews for her assistance in the RTI captures and Carla Schroer of Cultural Heritage Imaging for aid in identifying prior research.
Kurt Heumiller and Sue Ann Chui would like to make a special acknowledgment of our coauthor and colleague, Gregory Williams. His hard work, knowledge built over nearly forty years of imaging experience, and constant drive to find ways to improve the work we do made this project possible. While Greg is no longer with us, his contributions to the field of cultural heritage imaging continue to be an inspiration, and we would like to dedicate this essay to his memory.
Aure Calvet 2018
Aure Calvet, Xavier. “The Application of 2.5D and 3D Technologies for the Conservation and Presentation of Surface Texture in Paintings.” PhD dissertation, University of the West of England, 2018.
Baratin et al. 2016
Baratin, Laura, Sara Bertozzi, Elvio Moretti, and Roberto Saccuman. “GIS Applications for a New Approach to the Analysis of Panel Paintings.” In Digital Heritage: Progress in Cultural Heritage: Documentation, Preservation, and Protection: 6th International Conference, EuroMed 2016, Nicosia, Cyprus, October 31–November 5, 2016, Proceedings, Part I 6, 711–723. Cham, 2016.
Brewer 1999
Brewer, Al. “Effects of Batten Reinforcements on Paintings on Wood Panel.” In ICOM Committee for Conservation Triennial Meeting (12th), Lyon, France 29 August–3 September 1999, vol. 1, 276–281. Lyon, 1999.
Brewer 2000
Brewer, Al. “The Effects of Reinforcements on the Preservation of Paintings on Wood Panel.” Hamilton Kerr Institute Bulletin, no. 3 (2000): 48–49.
Brewer and Forno 1997
Brewer, Al, and Colin Forno. “Moiré Fringe Analysis of Cradled Panel Paintings.” Studies in Conservation 42, no. 4 (1997): 211–230.
Dellepiane et al. 2006
Dellepiane, Matteo, Massimiliano Corsini, Marco Callieri, and Roberto Scopigno. “High Quality PTM Acquisition: Reflection Transformation Imaging for Large Objects.” In VAST ’06: Proceedings of the 7th International Conference on Virtual Reality, Archaeology and Cultural Heritage, 179–186. Nicosia, Cyprus, 2006.
Fua and Sander 1992
Fua, Pascal, and Peter Sander. “Reconstructing Surfaces from Unstructured 3D Points.” In Computer Vision—ECCV'92: Second European Conference on Computer Vision Proceedings 2, Santa Margherita Ligure, Italy, May 19–22, 1992, 676–680. Santa Margherita Ligure, 1992.
Gautron et al. 2004
Gautron, Pascal, Jaroslav Krivánek, Sumanta N. Pattanaik, and Kadi Bouatouch. “A Novel Hemispherical Basis for Accurate and Efficient Rendering.” Rendering Techniques 2004 (2004): 321–330.
Klausmeyer 2009
Klausmeyer, Philip. “Reflectance Transformation Imaging for Museum Collections: A Worcester Art Museum and Cultural Heritage Imaging Collaboration” AIC News, November 2009, 12–14.
Malzbender, Gelb, and Wolters 2001
Malzbender, Tom, Dan Gelb, and Hans Wolters. “Polynomial Texture Maps.” In SIGGRAPH ’01: Proceedings of the 28th Annual Conference on Computer Graphics and Interactive Techniques, 519–528. Los Angeles, 2001.
Manfredi et al. 2013
Manfredi, M., G. Williamson, D. Kronkright, E. Doehne, M. Jacobs, E. Marengo, and G. Bearman. “Measuring Changes in Cultural Heritage Objects with Reflectance Transformation Imaging.” In Proceedings of 2013 Digital Heritage International Congress (DigitalHeritage), vol. 1, 189–192. Marseille, 2013. doi: 10.1109/DigitalHeritage.2013.6743730.
Mencl and Muller 1997
Mencl, Robert, and Heinrich Muller. “Interpolation and Approximation of Surfaces from Three-Dimensional Scattered Data Points.” In Proceedings of the Scientific Visualization Conference (dagstuhl’97), 223–232 Dagstuhl, Germany, 1997.
Mudge et al. 2017
Mudge, Mark, Marlin Lum, Carla Schroer, and Tom Malzbender. “Reflectance Transformation Imagine Guide to Highlight Image Capture.” 2017. https://culturalheritageimaging.org/What_We_Offer/Downloads/RTI_Hlt_Capture_Guide_v2_0.pdf.
Over et al. 2021
Over, Jin-Si R., Andrew C. Ritchie, Christine J. Kranenburg, Jenna A. Brown, Daniel D. Buscombe, Tom Noble, Christopher R. Sherwood, Jonathan A. Warrick, and Phillipe A. Wernette. Processing Coastal Imagery with Agisoft Metashape Professional Edition, Version 1.6—Structure from Motion Workflow Documentation. No. 2021-1039, US Geological Survey. Washington, DC, 2021.
Padfield, Saunders, and Malzbender 2005
Padfield, Joseph, David Saunders, and Tom Malzbender. “Polynomial Texture Mapping: A New Tool for Examining the Surface of Paintings.” In ICOM Committee for Conservation 14th Triennial Meeting, 504–510. The Hague, 2005. https://www.icom-cc-publications-online.org/2079/Polynomial-texture-mapping--a-new-tool-for-examining-the-surface-of-paintings.
Ponchio, Corsini, and Scopigno 2018
Ponchio, Federico, Massimiliano Corsini, and Roberto Scopigno. “A Compact Representation of Relightable Images for the Web.” In Proceedings of the ACM Web3D (International Symposium on 3D Web Technology). New York, 2018. http://vcg.isti.cnr.it/Publications/2018/PCS18.
Robson et al. 1995
Robson, Stuart, Al Brewer, M.A.R. Cooper, T. A. Clarke, J. Chen, H. B. Setan, and T. Short. “Seeing the Wood from the Trees: An Example of Optimised Digital Photogrammetric Deformation Detection.” In Proceedings of the ISPRS Intercommission Workshop “From Pixels to Sequences,” Zurich, March 22–24, 1995, 379–384. International Archives of Photogrammetry and Remote Sensing (IAPRS), vol 30, pt. 5W1. Zurich, 1995.
Schroer et al. 2014
Schroer, Carla, Mark Drew, Mark Mudge, and Mingjing Zhang. “Accurate Measurement and the Quantification of Surface and Material Property Change Using New RTI and AR Techniques.” In RATS: Research and Technical Studies Specialty Group Postprints from the AIC 42nd Annual Meeting, May 27–June 1, 2014, 74–88. San Francisco, 2014.
Stöcklein, Konopka, and Kaliske forthcoming
Stöcklein, Josef, Daniel Konopka, and Michael Kaliske. “Panel Paintings at Climatic Loads: Structural Analysis, Numerical Modelling and Validation.” In Postprints of Wood Science and Technology III. Forthcoming.
Tetzlaff 2024
Tetzlaff, Michael, “High-Fidelity Specular SVBRDF Acquisition from Flash Photographs.” IEEE Transactions on Visualization and Computer Graphics 30, no. 4 (2024): 1885–1896. doi: 10.1109/TVCG.2023.3235277.